Through A Glass Darkly: Equinox Reflections On Sea Ice--2010 And Onwards
The Spring 2011 update in a series of equinoctial reflections upon the sea ice. The original post, from 9/24/10, can be found below.
--Doc, 3/25/2011
There's quite a bit of good information in both the original Hub and in the update--from an historical perspective and some basics and reaction, too. But for more recent Hubs on this topic, see the links below.
--Doc, 11/5/2012
Sea Ice Hubs by Doc Snow
- A Love Story And A Clearance Sale
Arctic sea ice is 'far away' for most of us--but will it become 'long ago', too? There's reason to fear just that--here's why the author cares, and why more practically-minded readers should, too. - Sea Ice Loss 2012: What Do The Records Mean?
Labor Day 2012 saw shocking new record lows for Arctic sea ice--and the records continued dropping. Here's the larger context, and why you should care.
Spring Equinox, 2011
I'm a bit nervous, in a low-intensity--yet persistent!--sort of way. When I started this Hub last fall, I was disturbed at what I had seen happen to the Arctic sea ice. I remain so; reasons to be disturbed, unfortunately, have not abated. The annual cycle has turned once again and the North Pole is now tipped toward the sun, a new six-month daytime begun. The curtain is just opening on the Arctic Ice Show for a new season. What are we likely to see?

I still don't have the gift of prophecy. However, there are a few hints of what might come--and a few things to note in passing, too--as days here in the Northern hemisphere lengthen. Let's take a look at what happened to the sea ice first.
The Arctic Sea Ice
It's notable that we did not see a false recovery in ice extent this year, as we did in 2011. Although the El Nino of 2010 faded to a La Nina during the last months of 2010, sea surfaces temperatures in Arctic waters remained very warm by normal standards, especially in Baffin Bay, in Canada's Eastern Arctic. (El Nino tends to raise global mean temperatures slightly; La Nina has the reverse effect.)
The result was a slow freeze-up; Hudson Bay and the Western coast of Greenland in particular remained ice-free longer than normal. And low ice extents off Canada's East Coast meant a second consecutive year of hardship for the Harp Seal population--the seal pups are born and raised on the sea ice.
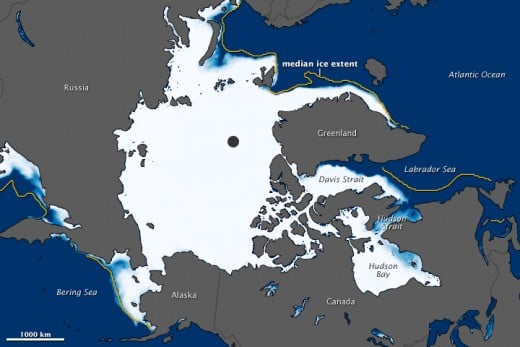
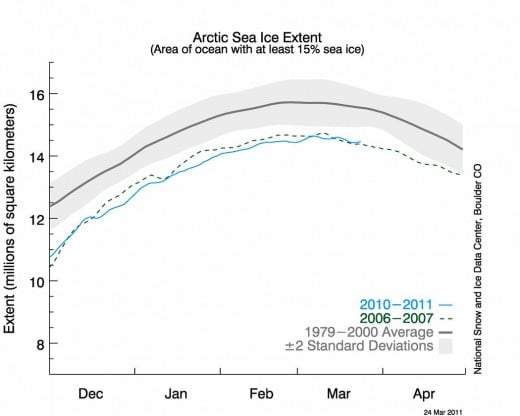
Early in the year a new record for lowest mean January sea ice extent was set, as illustrated to the right. Then the previous February low--a record set in 2005--was matched. So it has continued to date. 2011 nearly matched the record low maximum sea ice extent from 2006 (shown below.)
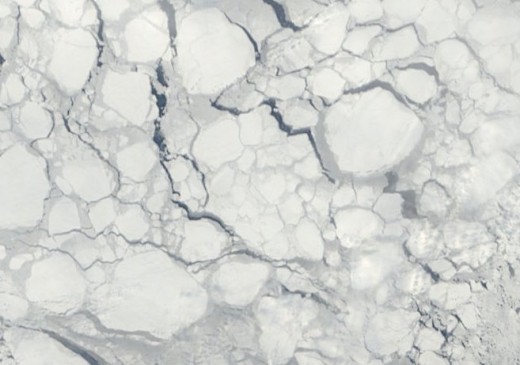
Nor does the ice look very solid. As was the case in 2010, there are comparatively widespread areas of fracturing and open-water 'leads.' Of course, these leads are still freezing over rapidly; although Arctic temperatures are above normal, as has been the case for much of the Arctic over much of the winter, it is far from warm.
The Antarctic
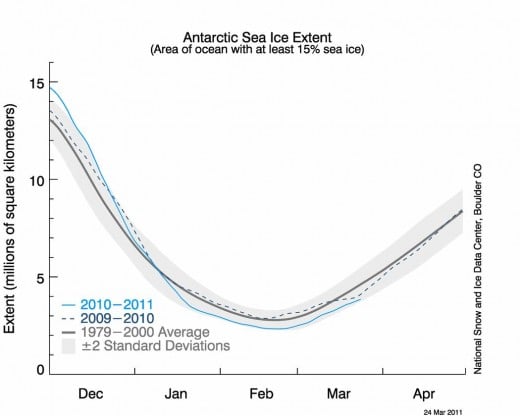
The main venue for melting sea ice is the Arctic--at least, it is if you are considering a changing pattern of melt; in the Antarctic, sea ice melt has always been greater as a percentage of total sea ice area. Typically, it is around 80%, with seasonal minima near 3 million square kilometers. But this year the melt in the Antarctic merits a mention, too.
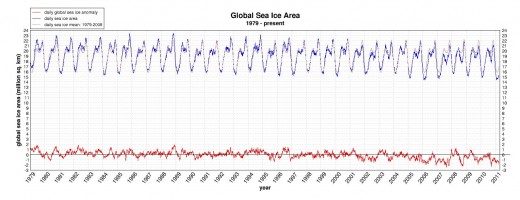
In contrast to the Arctic trend toward lower and lower extents, sea ice extent in the South has been increasing slightly. But this year put an end to that trend temporarily, with a minimum extent significantly below the norm. The result is a global sea ice extent near low-record levels.
So what's the bottom line?
Well, I don't do prophecies. Arctic sea ice is extremely variable, and frequently makes fools of those who venture to prophesy; sunny bright days can turn overcast, winds and currents can shift, and temperatures can change. But there does seem to be real vulnerability here.
As I said, I'm a little nervous.
Politics
It is a tangled web, indeed.
Climate change deniers now form a majority in the U.S. House of Representatives. This fact has so far led to a attempt--fortunately dead upon arrival in the Senate--to block the Environmental Protection Agency from enforcing restrictions upon emissions of greenhouse gases; to hearings notable both for the contempt shown scientists and the credence given to the most foolish of denialist cliches; and rumblings about defunding any NASA program studying climate change. Apparently, it is no longer sufficient to ignore scientific conclusions on climate change; now the data itself has to be suppressed by political fiat. It seems insufficient to call this "disturbing."
On other political fronts, we have steeply rising oil prices, due to the unrest of the "Arab awakening," currently playing out bloodily upon the Libyan sands as well as more peacefully in other Arab lands. Combined with this, we have the continuing nuclear drama of Fukushima in the wake of the Japanese tsunami. Several nations have already called a moratorium on new nuclear development, though it remains to be seen how durable these will prove. All of this should be a boost for renewable sources of energy; but it's never wise to assume a rational political response to crisis.

Science
It's been a tough winter for climate science in some ways.
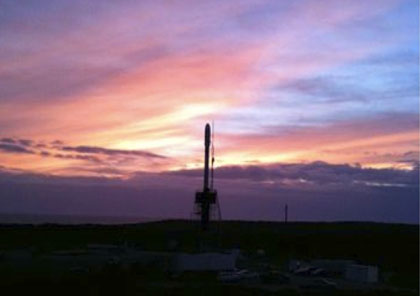
A parade of hearings confirmed that, despite all the melodramatic foofaraw of the Climategate "scandal," no scientific misconduct had taken place. But an essential data collection project fell victim to a launch accident, when, on March 4, the Glory satellite fell into the ocean. (A fairing failed to separate as it should, and the extra weight was too much for Glory to reach orbit.) Sensors on board would have contributed to the study of clouds, solar radiation, and (most significantly) atmospheric aerosols. Climate scientist and commentator Gavin Schmidt wrote, "There is a huge hole building in the US contribution to Earth and Sun observing systems."
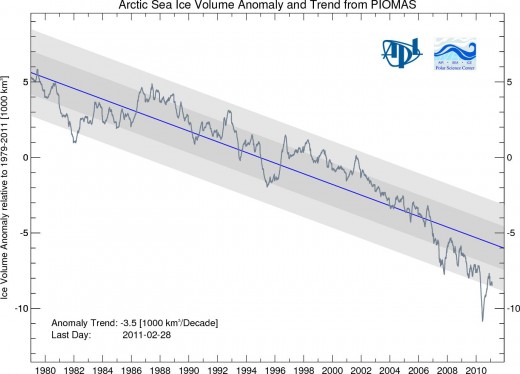
At least Cryosat, the European satellite launched to measure Arctic sea ice last fall, is working. Its shakedown period is complete, and data is now being released. It will be very interesting to see what conclusions emerge from the study of that data. Is sea ice volume declining as drastically as the University of Washington Piomas model indicates?
And it means--?
It means we wait. The ice has begun responding to the again sun, to the wind, to the ocean currents. What the degree of response will be remains to be seen.
The play is ready. Is it tragedy? History? Or a comedy of (human) error?
The curtain is just rising. . .

Below is the original entry in this series of equinoctial posts on Sea Ice, originally published 9/24/10.
Fall Equinox, 2010
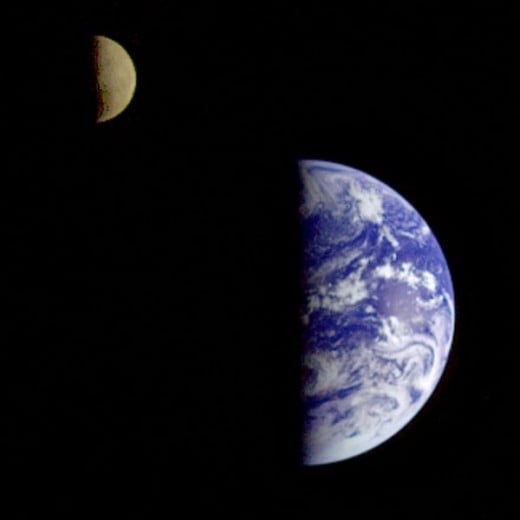
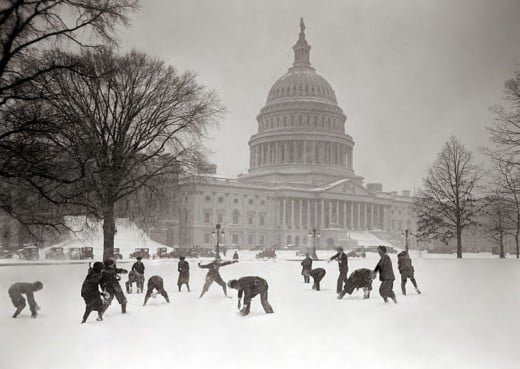
It’s just past the fall equinox, that day when the year turns from light to dark, summer to winter. Days have been growing shorter since the summer solstice, of course, but now the corner has been turned; the balance has shifted to night. It’s not that obvious, here, just going by the temperature. It’s been a very warm summer—recording-setting warm, actually—and that warmth seems reluctant to slip away to the tropics, as it must.
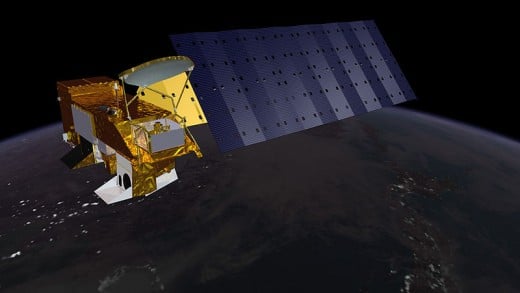
But I’ve been watching with more than just my own eyes. All through this long, hot summer I’ve been peering down at Earth through the sensors of humanity’s eyes in the sky: MODIS, with its the 36 frequency bands, flying aboard NASA’s “Terra” and “Aqua,” or the AMSU microwave sensors aboard NOAA satellites. Mostly, I look at the Arctic ice cap, curious and a little worried, to see how the melt season progresses.
This year was—exceptional. Those who pay attention to such things knew it would be warm; the central Pacific was plainly shifting into its El Nino mode, and when that happens, global temperatures rise a bit as energy is released from ocean to atmosphere. Sure enough, temperatures rose to record or near-record levels--even as irony-challenged politicians in certain locales proclaimed the end of global warming.
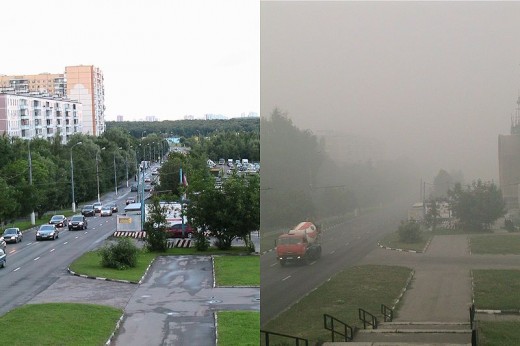
As the summer waxed, old temperature records fell all over the Northern hemisphere; in Russia the heatwave would be brutal enough to kill 11,000 people in Moscow alone, and would cost the nation an estimated 7-15 billion US dollars. Then monsoon rains in Pakistan would set new records, flooding the Indus River. A fifth of the country would go underwater, affecting 21 million people and costing as much as 43 billion US dollars. International aid will be required for years to come.
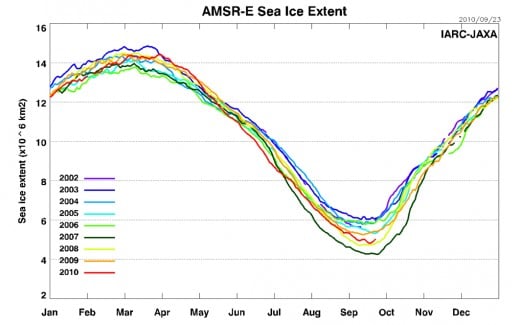
In a much quieter way, the trajectory of ice melt was nearly as dramatic. The ice extent started the year with near-record lows, but surprised everybody in March with an unexpected growth surge that brought it back almost to the historical mean—statistical territory unseen for a long, long time. Some applauded this “recovery,” though others pointed out that all this new ice must surely be very, very thin.
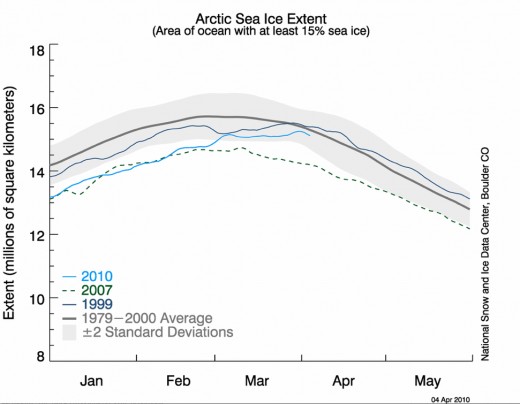
Their caution was justified. Early May began a roller coaster ride: extent fell precipitously to a record low monthly value for June; only to see a melt slowdown in July that allowed the 2007 records to prevail for that month; then another, sharper, slowdown in early August let 2008 slip past, too; and finally, stuttering ups and downs in September settled in to a near-tie with 2008. Through it all, the maps and photographs showed ice that looked cracked or shattered, often ponded with meltwater—ice that looked vulnerable.
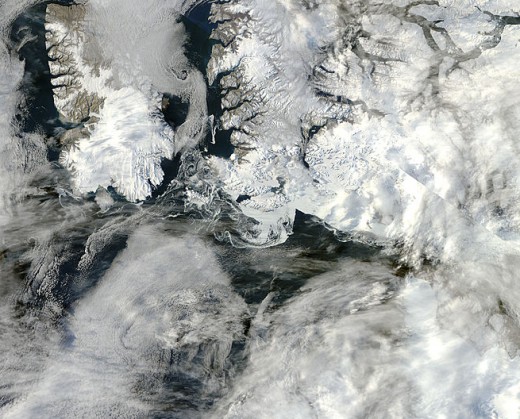
Now the ice is slowly growing once again. It’s time for reflection, for wondering what all those twists and turns and surprises meant. Not recovery: the pattern of consecutive increases in minimum set in 2008 and 2009 weren’t statistically enough to show that--though some prefer to believe otherwise. And that pattern was shattered, with a 2010 minimum 436 thousand square kilometers below 2009.
Still worse, ice volume may be decreasing faster than ice extent. It’s hard to measure volume from satellites, but estimates put it at a record low. Soon we’ll know more: Cryosat, already in orbit, will soon finish its shakedown period and begin the first series of regular satellite reports of ice volume. Many will welcome the debut of that new eye in the sky.
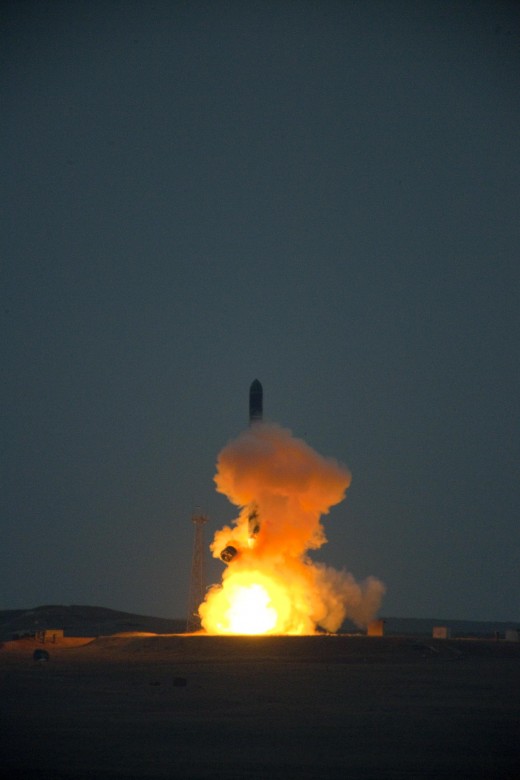
But I think I already know what will come—not in detail of course, but the essential picture. It’s presumptuous, perhaps; I’m not a scientist, and I don’t claim special gifts of prophecy. But sometimes “you don’t need a weatherman to know which way the wind blows.”
So, based on the Dylan Effect, I see ups and downs—that’s a clear message from this summer’s roller coaster. But each year there’s another two parts per million of CO2 in the atmosphere to warm; and if we are in the cooling grasp of La Nina now, El Nino will return again soon enough. On average, year over year, the ice will decline, melting back to the hard core of oldest, thickest ice jammed against the northern shores of Greenland and the islands of the Canadian Archipelago, like a besieged army retreating to a fortress.
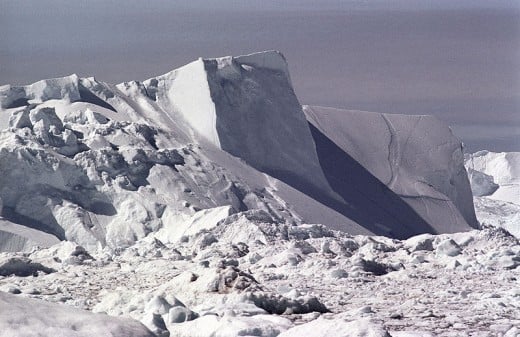
Then, one year in the not-too-distant future—three years, five years, ten or fifteen perhaps?—we’ll see another year like 2007. Sun, wind, and current will align against the diminished summer ice. And that last fortress of summer ice, that iron-hard core, cut off from meaningful replenishment, will melt away, too.
Shards will remain. There will be floes and bergs dotting the waters; there will be remnant shelves in deeply-cut sheltered fjords, where even the 24-hour Arctic sun can only shine briefly each day. The captains of the oil tankers plying the newly-freed sea lanes of the Arctic Basin will need to beware ice.
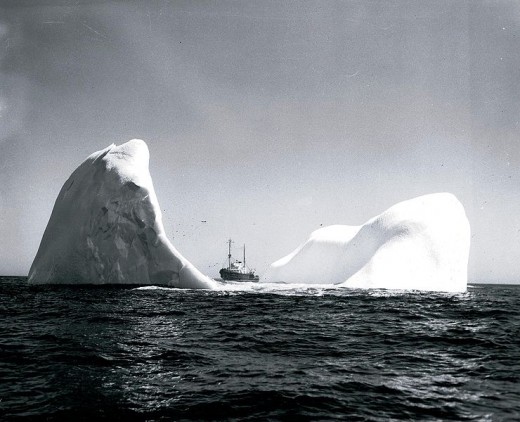
But the summer ice-cap will be gone. It will be missed: melting shores, newly exposed to a thousand miles of open water, will wash away in unaccustomed wave action like sand castles. Water vapor, unconstrained by ice, will pour into the Arctic atmosphere, augmenting the greenhouse effect and feeding storms quite different than those now experienced. Animals and plants will struggle to survive in habitats for which they are no longer suited; too often, they will fail in that struggle. The traditional peoples of the Arctic will see their lifeways rendered utterly irrelevant, dealing a heavy blow to a culture still trying to adapt to the majority culture’s ways and institutions.

And perhaps the methane, locked away for millennia in permafrost or hydrate deposits undersea, will begin to begin to reach the atmosphere in really significant quantities. If it does, it will be a “tipping point”: methane is 25 times more potent a greenhouse gas, molecule for molecule, than CO2. Then the changes will really start; and then perhaps—like a debtor for whom the repossessions begin in earnest--we will really begin to understand our situation in the world.
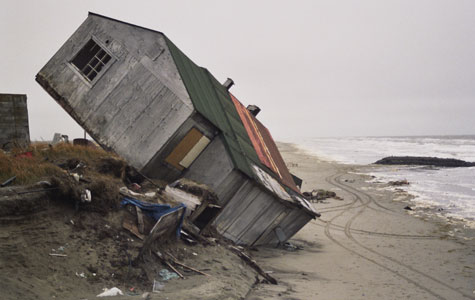
We’ll finally understand: all the Cassandras were right. We’ll understand that our position in the world is not guaranteed us, regardless of our own actions. That our welfare in this world is our responsibility, not God’s. And that, by protecting our comfort, we will have imperiled our very survival.

May the time remaining us when the summer ice is gone prove sufficient to our need.

- Hot Topic Global warming and the future of New Zealand
"Hot Topic" discusses global warming and the future of New Zealand. In this post, host "Gareth" parses the statistics from 2010 to offer some projections for the future.
Some Other Hubs By Doc Snow
- Global Warming Science: A Thumbnail History
Retired astronaut Walter Cunningham wrote: "About 20 years ago, a small group of scientists became concerned that temperatures around the Earth were unreasonably high and a threat..." Read what really happened here. - Global Warming Science And The Wars
The story of Guy Callendar--the man who brought global warming science into the 20th century. "Nearly everybody likes to be right, and scientists perhaps more so than the rest of us..." - "Crystal Waters": A Meditation
A hot night and a great song. "Its hot, really hot, and the wind is rising outside with the rising storm. Theres a squall line of sorts on the way..."

