Climate 2013--The Year In Prospect And Review

Introduction--Top climate stories of 2013 from two perspectives.
The original version of this Hub looked forward to top climate stories of the year. But how did things turn out?
Well, there's an update for that! Actually, five updates--one for each of the five areas looked at in the original post: Arctic sea ice, wild weather, the initial release of the Fifth Assessment Report by the IPCC, the 19th Conference of the Parties in Warsaw, and the deployment of renewable energy around the world. Read on!
Original post
As 2013 settles in—or we settle in to it!—several climate change stories are unfolding. Comparatively little-remarked by most people, despite the dueling efforts of ‘alarmists’ to publicize the dangers of climate change and of ‘deniers’ to, well, deny them, these stories offer hints of ‘the shape of things to come,’ to borrow H.G. Wells’s phrase. It's even possible that we could see real 'turning points' this year—turning points that may be decisive for our own lives in the decades to come.
What are these stories? Why is each important, and what are the ‘back stories?’ And what should we be watching for as this year unfolds? Some stories are physical ones—they concern events that have happened, or may happen, in the real physical world. Some are political stories about the human struggle to craft policy responses, or scientific stories about the equally human struggle to understand the physical world. And some are about the struggle to adapt to the new reality in which we find ourselves by transforming our energy economy.
For each story, we’ll sketch the context and current situation, discuss its importance, and look forward to the likely (or at least possible) story developments to watch during this year and beyond.
Let’s start with the physical stories.

Arctic Sea Ice
Context: The Arctic sea ice has formed a floating ‘lid’ on the Arctic Ocean for something like 2.6 million years. Its most recent maximum extent occurred about 21,000 years ago, during the height of the last glacial period. The Arctic is estimated to have been about 20 C colder than at present.
But natural cyclic orbital changes brought warming in its turn. This warming reached its height about 11,000 years ago. At that time, Arctic temperatures were probably 1 to 3 C warmer than the 20th century average, and less sea ice existed than the 20th century average. The global climate has been generally cooling since, reaching a cool 'trough' during the Little Ice Age (roughly 1250-1850 CE.) This cooling, which was very marked in the North Atlantic region, famously drove the Norse settlements in Greenland to extinction.
Since the 1970s, however, there has been a very sharp warming, due largely to human-emitted greenhouse gases. Accurate, comprehensive satellite measurements of Arctic sea ice began in 1979; since then, sea ice has declined dramatically in extent (geographic spread), area, and volume.
Most notable has been the decline in volume. Although ice volume is the most difficult parameter to observe, it is arguably also the most important for assessing the sea ice decline. It is appalling, and appallingly little known, but as measured at the time of the annual September ice minimum, volume has declined by approximately 80% since satellite observations began.
The annual minimum in 2012 set multiple records, with a lowest-ever extent of 3.3 million square kilometers. In general, the sea ice parameters for 2012 were 10-25% lower than ever previously observed.


Importance: The sea ice is an important influence on atmospheric and oceanic circulation, on the energy budget of the Arctic Ocean as it absorbs radiation from the sea and releases some of that energy in turn to the atmosphere. It’s an important habitat for wildlife, affecting everything from polar bears to bacteria to seaweed to humans, and an important factor in the physical geography of the Arctic.
Without it, we may experience unpredictable and damaging weather—research has, for example, linked Superstorm Sandy to the low ice levels of 2012—further warming due to various ‘feedbacks’, serious biodiversity loss, unpredictable ecological changes, and cultural and economic challenges to the human inhabitants of the region, name a few of the most significant issues.
Watch for: The melt season of 2013. In March, the long polar night comes to an end and the high Arctic begins to experience uninterrupted daylight lasting until near the fall equinox. Early signs suggest the existence of lots of thin, fragile ice that may be more vulnerable to melt than in the past.
Will we see new low records set? Or will there be a small ‘recovery,’ in which random, natural variations in weather create a slightly larger sea ice pack than last year’s? Will ways the melt develops in space and time hold hints for its future? In 2007, Dr. Walt Serreze of the National Snow and Ice Center famously said that the sea ice was in a “death spiral.” That certainly appeared to be the case in 2012. What about 2013?
- October | 2013 | Arctic Sea Ice News and Analysis
National Snow and Ice Data Center summary for September, 2013.
Sea Ice Update
Arctic sea ice surprised most folks in 2013, including this writer. Though the summer of 2013 was not particularly cool, considering the Northern Hemisphere as a whole--according to NASA, the period of June through August, 2013, tied for the 6th-warmest period ever--the high Arctic experienced a relatively cool summer, and the ice responded accordingly. As shown in the graph and table below, ice extent rebounded to a level not seen since 2009--though that is still the 6th-lowest extent ever observed.
Note also, though, that the effect on the long-term linear trend is fairly minimal--it decreased from 14% loss per decade in 2012 to 13.7% this year. Though some would have you think otherwise, the 'death spiral' is continuing, as far as we can tell at this point.


Update 1/11/14: Inuit Mental Health
- Climate change rattles mental health of Inuit in Labrador - Technology & Science - CBC News
Researchers studying the mental health and well-being of Inuit populations in coastal Labrador say rising temperatures are having damaging psychological effects on people in traditional communities. Arctic sea ice loss is a leading factor.

Wild Weather
Context: In 2012, the US experienced its warmest year on record, plunging roughly 80% of the country into drought conditions at one point. The drought depressed agricultural production and cost nearly $12 billion in insured crop losses alone and killed 123 people.
The heat also brought wildfires to 9.2 million acres. These fires killed another 8 people and cost an estimated $2 billion.
The year was capped by the devastation of Superstorm Sandy, which killed 147 and cost an estimated $65 billion in the US alone.
During the year, there were 11 ‘billion-dollar’ extreme weather events. That is second only to the record 14 such events logged in 2011.
But wild weather was hardly limited to the US. The Philippines also suffered a devastating blow from Typhoon Bopha, also known as Pablo. 740 persons died, and a further 890 are listed as missing. Economic losses are estimated at roughly $350 million US.
And Australia ended 2012 and began 2013 with the warmest summer ever recorded there; as in the US, wildfire was a prominent feature, with over 130 fires logged. Fortunately, there have been no reports of fatalities.
Importance: Extreme weather, especially drought, heatwave and wildfire, are expected to increase in a warming world, although the science exploring the details is still developing.
Losses in blood and treasure such as we experienced in 2012 are self-evidently important. They can also have political impact, as when President Obama gained the endorsement of New York mayor Bloomberg following Sandy. Enough of them could eventually change our society quite drastically, should the long term trends be unfavorable enough.


Watch for: whatever happens. Weather events are intrinsically unpredictable and frequently dramatic.
But let's not forget to watch the continuing stories: though the US drought has receded, it is still far from over, with over 50% of the nation still experiencing at least moderate drought conditions. Will the drought truly break, or will it redevelop in the summer of 2013?
Similarly, Australian warmth is again making headlines there, as their record warm summer is followed by early autumn heat as well. How much more of this will we see?
Turning to human responses to warming, there is a scientific and a political story to watch.
- PHOTOS: 2013's Most Terrifying Weather Disasters | Mother Jones
Extreme weather disasters of 2013, with photo gallery. - In The Midst Of Its Worst Drought In 50 Years, Brazil Hit By Deadly Flooding | ThinkProgress
The pattern of droughts and extreme precipitation events has been predicted to become more likely as the climate warms, as the Bahia flood exemplifies. - Weather Extremes : Heat Wave in Argentina, Flooding in Brazil | Weather Underground
Weather Underground article describing the heatwave and giving monthly weather data for Buenos Aires and Santiago Del Estero.
Wild Weather Update
Fortunately, wild weather wasn't quite as destructive in 2013 as in the previous year. The US saw an easing of drought conditions--whereas New Year's Day, 2013, saw only 27.22% of the lower 48 states free from drought, by the end of the year that number stood at 38.27%. Conversely, the percentage afflicted by the most severe drought fell from 6.75% to 4.40%. Drought-related losses are still reported to have reached more than $2 billion, however.
By contrast, Brazil saw its worst drought in 50 years, with an estimated $8 billion US in damages. Irony was added in December, when parched Bahia state received 4.7 inches of rain in a few hours: "... the dry, hard-packed ground [was] unable to absorb much of the deluge." Eleven people died. Elsewhere in South America, Argentina experienced a brutal heatwave in December, prompting an emergency declaration in Buenos Aires due to power and water shortages. Three people died during the warmest December (and warmest month) ever observed in the city. But for really extreme heat, try Santiago Del Estero, where every day from December 22 onward saw a maximum temperature of 40 C or greater, and the average temperature exceeded 30 C.
But no weather event was more dramatic than Typhoon Haiyan/Yolanda, which (as of December 26, 2013) had killed 6,155 people, with 1,785 still missing. This is the highest toll for such a disaster in the Philippines during modern times, and its second-highest ever. (Around 20,000 people are estimated to have died from the effects of an 1881 storm.) Haiyan also caused over $800 million US in direct costs, and sparked a hunger strike at the Conference of Parties in Warsaw in support of increased action to lessen carbon emissions.

- Anthropogenic contributions to Australia's record summer temperatures of 2013 - Lewis - 2013 - Geoph
Dr. David Karoly's paper attributing record 2013 Australian warmth to anthropogenic climate change. - 2013 was hottest year on record in Australia, Bureau of Meteorology says - ABC News (Australian Broa
Australia has just sweltered through its hottest year on record, according to the Bureau of Meteorology. Average temperatures were 1.20 degrees Celsius above the long-term average of 21.8C, breaking the previous record set in 2005 by 0.17C. - China endures worst heat wave in 140 years
The heat wave has left dozens of people dead and pushed temps above 104 degrees.
Australia's "Angry Summer" shattered many heat records early in 2013, even while much of the Northern Hemisphere experienced unusual cold as a persistent high pressure system over Greenland set up a 'blocking pattern.' But the heat didn't end there; the Australian Bureau of Meteorology announced recently that 2013 was the warmest year on record for that nation. A research paper in Geophysical Research Letters formally attributed the remarkable heat to anthropogenic climate change (see sidebar link, above.)
East Asia also saw record heat during the year, with a summer heatwave affecting Japan, Korea, and wide areas of China. Shangai, for example, saw 28 consecutive days with temperatures above 35 C. The heatwave was said to be the worst in 140 years, and killed "dozens" of people.
Several remarkable floods occurred in 2012: June saw 100-year floods in the Czech Republic, Austria, south and east Germany, Switzerland, Slovakia, Belarus, Poland, Hungary and Serbia. Eleven people died.
Canada saw historic flooding on June 20, with 4 dead and $1.7 billion (Cdn) in damages resulting from downpours which submerged much of downtown Calgary. In July Toronto received its turn when a remarkable thunderstorm dumped 126 mm of rain on the city--more than Hurricane Hazel's record 121.4 mm in 1954. Costs reached at least $800 million.In September Colorado experienced its heaviest rains ever, costing 8 dead, 6 missing, and over $1 billion US in damages. But the most costly of all was likely June flooding in India, in which 6,500 are thought to have died. Costs exceed $1 billion US.
Final numbers have yet to come in, but 2013 was clearly a very costly year, if less bad than 2012.

IPCC Fifth Assessment Report
Context: Most folks have heard of the International Panel on Climate Change, though many misconceptions about this body still exist. It exists to evaluate, synthesize, and summarize the best scientific research relevant to the issue of climate change. Its most visible and comprehensive work consists of periodic reports presenting the ‘state of the art’ science. Its fifth report will be coming out in stages beginning this fall; the first installment will be the “Physical Science Basis” group’s report, to be published between the 23rd and 26th of September. The concluding installment, the “Synthesis Report,” will come out in October of 2014.

Importance: Though portions of the “second order draft” have been leaked to denialist blog sites with much fanfare, real consideration of its contents will only begin in earnest upon the release of AR5. What will the report say about the observed progress of climate change since the last report in 2007? Will we see new discoveries, better estimates of critical factors (such as ‘climate sensitivity’), or new projections for the future?
Though the IPCC remains the butt of ongoing attempts to smear and discredit its work, it is by far the most authoritative source of scientific information on climate change. AR5 will shape the discussion of climate change related issues for the next half-decade or so.
Watch for: results and spin. The results will be voluminous, spanning a vast spectrum of contemporary science. Some results will surely reflect the fact that in several respects, things are worse than previously thought. (Some examples of this include the sea ice decline noted above, ocean acidification, and projections of future sea level.)
The spin will be voluminous, as well. Those who do not want the problem of climate change to exist will either try to use the results of AR5 to support their efforts to minimize the problem, or to contend that the results should be ignored or dismissed. (Based on past behavior, some will choose, not very coherently, to try both tactics.) Expect much heat, but little light.
- What Does the New IPCC Report Say About Climate Change? | Serendipity
Warming's unequivocal and mostly irreversible; most goes into the ocean. Humans caused most of it. Ocean acidification is unprecedented. We must soon choose a carbon-negative economy to avoid 2 C warming, with most fossil fuels staying in the ground.
AR 5 Update
The first part of the International Panel on Climate Change Fifth Assessment Report is now out, in the form of a 'final draft' of the Working Group I report on the essential scientific basis. 'Final draft' means that the text is essentially complete, but needs further proofreading and editing prior to its official publication. (The figures and tables--currently at the ends of chapters--will also be placed in their proper contexts, which will make for greatly improved readability.)
However, the text will not change substantively, which means that we can begin to digest the massive document. A thoughtful summary is available from Canadian blogger Steve Easterbrook (see sidebar link.)
In most respects the science has improved to give a clearer, more detailed picture of the changes now taking place in our world--as well as of those yet to come. For example, new information on sea surface salinity has a great deal to say about the patterns of change in the global water cycle. Such new information, combined with another 5 years of data and scientific progress across the board, means that uncertainties have been reduced in many areas.
Unfortunately, uncertainties are still much greater than we would like in determining climate sensitivity to greenhouse forcing. The 'equilibrium climate sensitivity'--the medium-term response of Earth to forcing--is now estimated as:
...likely in the range 1.5°C to 4.5°C (high confidence), extremely unlikely less than 1°C (high confidence), and very unlikely greater than 6°C (medium confidence).
That is actually a slightly wider range than in the previous report, where the lower bound was put at 2°C.
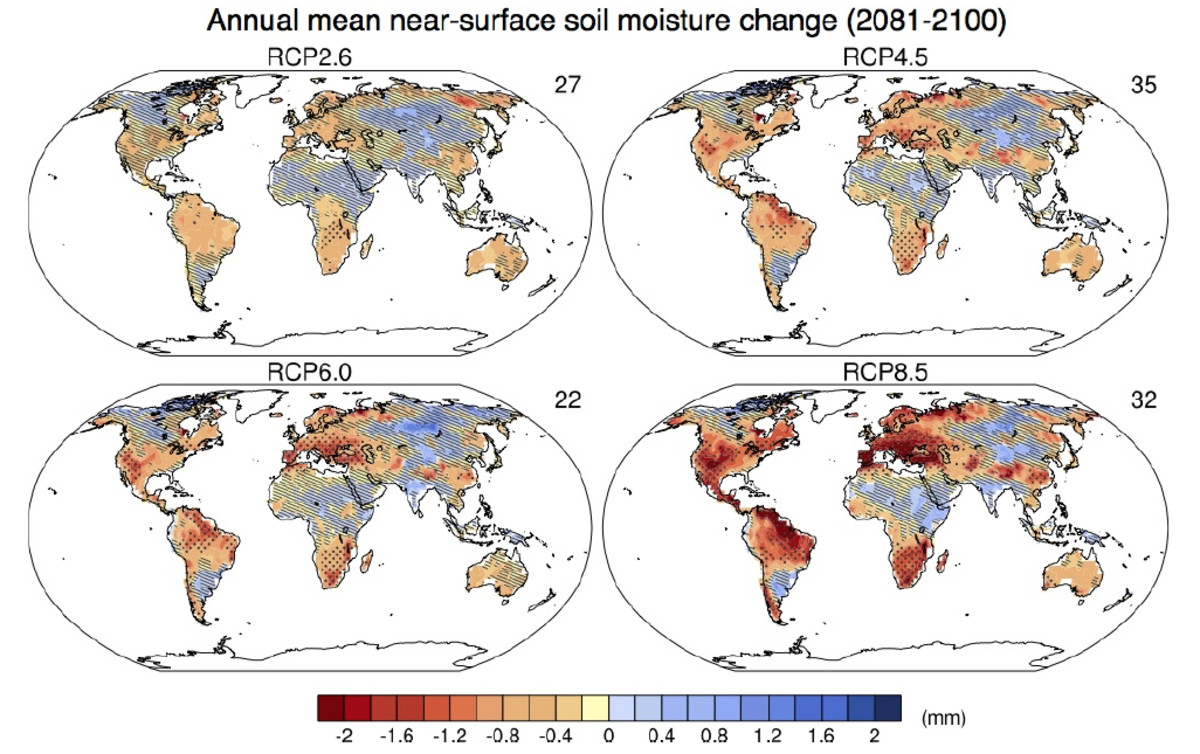
Similarly, uncertainty has increased in projections of drought. The same 'drought hotspots' identified in previous work are still expected to see significant drying: the American southwest, the Mediterranean basin, the Amazon, South Africa and parts of Australia. (See the maps above.) But global trends have become less clear: increasingly sophisticated methods producing more complex and less certain 'pictures' of how drought will develop under increased warming, raising new questions.
Overall, Mr. Easterbrook's 'takeaways' are hard to improve upon. Here's my paraphrase:
- Warming is unequivocal and mostly irreversible.
- Humans caused most of it, and most goes into the ocean.
- Ocean acidification is unprecedented.
- We must soon choose a carbon-negative economy to avoid 2 C warming, with most fossil fuels staying in the ground.

The 19th Conference of the Parties ("COP")
Context: Less-known is the annual Conference of Parties. This conference is the centerpiece of what has been known as the “Kyoto process.” Presumably that process will soon acquire a new moniker, as the Kyoto Protocol is reaching the end of its term. Indeed, the main task of the Conference is to negotiate an agreement to replace Kyoto.
The Conference occurs under the auspices of “UNFCCC”—the United Nations Framework Convention on Climate Change. This agreement was concluded in 1992; Kyoto was agreed in 1995, came into force in 2005, and will end in 2020. The stated aim of the Parties is to have a new agreement in place by 2015. The 2013 iteration of the Conference—the 19th COP—will take place in Warsaw, Poland, from November 11th through the 22nd.

Importance: Though harsh denialist criticism of the process is an online staple, the reality is that there is no alternative to the UNFCCC process, if greenhouse gas emissions are to be reined in. Denialists tacitly make this very point when they argue that emissions cuts by this or that nation are pointless “because China and India will make them moot.”
Unilateral national action, though helpful and welcome, will not be enough, since even relatively large national emitters still contribute only a few percent of global emissions. (For example, in 2008 India, the 3rd-largest national emitter, contributed only about 5.8% of the global total.) Emissions mitigation must be international.
Unfortunately, it is true that the UNFCCC process has been torturously slow, bedeviled by foot-dragging from large emitters such as the US and China, and from petro-states and other nations dependent upon fossil fuel production. Officially proposed ambitions for action remain too modest to achieve the stated goal of limiting warming to less than 2 degrees Celcius.
The metaphor of a UNFCC process on “life support” seems appropriate—though some optimists assert that the progress that is being made should encourage all of us. One hopes, rather than concludes, that they are correct.

Watch for: the disappointment index in general on one hand, and on the other for signs of developing nations agreeing to make meaningful commitments to mitigate their emissions. With China now contributing nearly a quarter of global emissions, Chinese participation is especially critical. The future responsibilities of developing nations are likely to be the most critical point of the process.
However, American emissions are about 18% of the global total current global total, and completely dominate the cumulative emissions history. Positive US leadership in the UNFCCC process would be extremely helpful. With President Obama having ending his prolonged silence on the issue of climate change, it is perhaps also more likely than in the past.

- http://unfccc.int/files/press/news_room/press_releases_and_advisories/application/pdf/131123_pr_clos
Closing press release of the 19th COP in Warsaw.
COP 19 Update
The 19th Conference of the Parties ('COP19') in Warsaw ran more or less to expectations: although complete breakdown was averted with a minimal set of agreements allegedly keeping the process "on track" toward a universal agreement to be signed in 2015 in Paris, most observers were underwhelmed. (The official press release can be read at the sidebar link above.)
Negotiations were fractious, featuring walkouts and hunger strikes, and several governments played roles that were less than helpful. Worst of all, the so-called 'ambition gap' (between announced measures and the targets they are meant to attain) is as wide as ever. The process is scheduled take its next lurching step forward in Lima, Peru, in late 2014.

Renewable Energy
Context: Renewable energy seemed the ‘wave of the future’ following the oil shocks of the 1970s. But economic competitiveness proved elusive. Since the early 1980s, renewable energy use in the United States had remained more or less stagnant. But that changed. Since 2001, the deployment of renewable energy has increased sharply.
Nor was the US alone in this. In the European union, according to the European Commission:
The quantity of renewable energy produced within the EU-27 increased overall by 72.4% between 2000 and 2010, equivalent to an average increase of 5.6 % per annum.
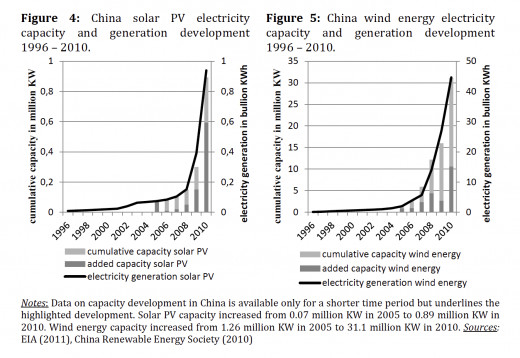
China was a little later in adding renewable energy generation capacity, but has made stunning progress:
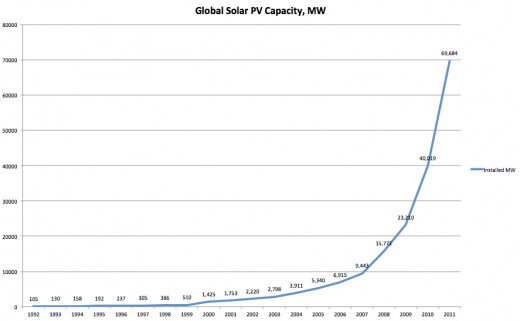
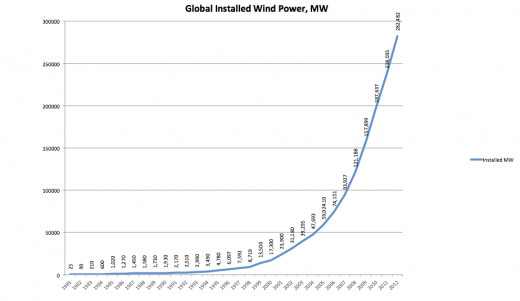
Other developing nations have been following suit as well, resulting in global growth curves for renewable energy capacities that are truly eye-popping:
Another factor that is little appreciated is how greatly the price of electricity-producing photovoltaic solar technology has fallen. (This is often referred to as "solar PV.")
As a 2012 report from IRENA (International Renewable Energy Agency) puts it:
PV has made remarkable progress in reducing costs, as until recently grid parity still seemed very far away. It was only a few years ago that PV electricity was four to five times more expensive than fossil fuels. However, with increases in fossil fuel prices and continuing cost reductions in PV modules, grid parity could occur as early as 2012 to 2013 in sunny regions of USA, Japan and Southern Europe. Other regions with lower electricity production costs and/or more moderate solar resources may achieve grid parity as early as 2020 (Breyer and Gerlach, 2011). That is without taking into account that PV is often already competitive for peak power production, for generation in grid-constrained areas, and for many off-grid applications.
This price reduction is graphed in the same report:

Importance: Developing nations will not agree to a future in which they are condemning to relative poverty, which means that they will not agree to curbs on energy use.
Given the widespread distrust of nuclear power generation, its frequent failure to live up to projections of affordable costs, and the difficulties of scaling up nuclear-powered generation capacity--how fast could we double the number of nuclear engineers we train, for instance?--renewable energy sources appear to be the only way to increase available energy without also increasing the global carbon footprint, just when we should be cutting it!
Therefore, they seem also to be our best current hope to start to bring global carbon emissions under control.
The rapid spread of renewable energy technologies in recent years has been one of the few encouraging stories on the climate change front. With time to make make real emissions cuts growing short, will this rapid deployment continue? The answer could be critical for the future health, wealth and well-being of human society.

Watch for: the economics, politics and technology of renewables. Will costs continue to fall? Will adoption rates continue at the recent high levels? In particular, will the population giants India and China, continue to meet their deployment targets?
And will renewables continue to have good political acceptance globally and in critical nations such as the US--or will the opposition to them gain wider traction with such tactics as the promotion of "wind turbine syndrome"--an ailment which seems likely not to actually exist? There is a visible 'renewables backlash' on some news sites online, perhaps fueled by corporate 'astro-turfing' efforts. Will this backlash gain media traction?

- http://about.bnef.com/files/2013/04/BNEF_PR_2013-04-22_global_renewable_energy_market_outlook.pdf
Bloomberg New Energy report. - The beginning of the end for centralised generation? : Renew Economy
The centralised generation model is in decline in Central Europe, UBS analysts say; 30% of fossil fuel capacity may need to be shut down to preserve profitability of the corporate owners of idle gas and coal plants.
Renewable Energy Update
Renewable energy provides the best news overall for 2013. The progress of renewables continued to dazzle in the past year, with large amounts of capacity added globally. Final numbers will not be available for some time, but record years were seen in China and the US, among other places. Forecasts estimated US solar capacity added in 2013 to be close to 5 GW, while China added 3.6 through the end of October. (The latter also added 7.9 GW of wind capacity, as well as 2.2 GW of non-renewable but also non-carboniferous nuclear power.)
According to Bloomberg:
New research by analysts at Bloomberg New Energy Finance show that annual investment in new renewable power capacity is set to rise by anywhere from two and a half times to more than four and a half times between now and 2030. The likeliest scenario implies a jump of 230%, to $630bn per year by 2030, driven by further improvements in the cost-competitiveness of wind and solar technologies relative to fossil fuel alternatives, as well as an increase in the roll-out of non-intermittent clean energy sources like hydro, geothermal and biomass.
The report envisages a total installed renewable energy capacity of 3,500 GW by 2030, under its 'middle of the road' scenario. (For context, one 'stabilization wedge' (see sidebar link, below) required the displacement of 700 GW of coal power as of 2008.) Renewables would provide 37% of the world's energy.
- Six Degrees: Choosing Our Future
"Choosing Our Future" is the culminating chapter of Mark Lynas's "Six Degrees." In it, possible strategies for the preservation of human prosperity--and, indeed, culture--are examined.
Dominating the picture are the still-falling prices of renewables. The report quotes Guy Turner, head of economics and commodities for Bloomberg New Energy Finance:
The main driver for future growth of the renewable sector over this timeframe is a shift from policy support to falling costs and natural demand. Our work also highlights, however, the importance of planning for the integration of intermittent renewables into the grid and into power markets. This will require significant new investment in grid infrastructure, load management and storage technologies.
Echoing this view, Michael Liebreich, chief executive of Bloomberg New Energy Finance said:
The news right now is dominated by stories of pain caused by overcapacity on the supply side of clean energy, and the lure of cheap shale gas. But this is playing out against the falling costs of renewable energy and of all the technologies required to integrate it into our energy system, and falling costs win. What it suggests is that we are beyond the tipping point towards a cleaner energy future.
Another recent report paints a similar picture for the near term in Central Europe (also linked in the sidebar at the head of the section). There, fossil fuel capacity currently poses a serious financial risk for gas and coal plant owners. With solar energy supplying cheap power during peak periods, coal and gas generation plant are standing idle more and more of the time--one EON gas plant, Irsching-5, was used just 25% of the time in 2012. Unsurprisingly, its closure is being mooted in order to alleviate big losses--even though it only came online in 2010, at a cost of $523 million US!
According to UBS analysts, such carnage is just starting. 30% of fossil fuel generation capacity could be chopped for business reasons by 2017. In addition to about 7 GW of capacity already officially slated to close, "a further 41GW (19GW of coal and 22GW of gas) may have to be closed to restore the industry to profitability..."
That would be something less that a 50th of a stabilization wedge, but for one nation in just three years, it's at least encouraging.

Related Hubs by Doc Snow
- Amy Seidl's "Finding Higher Ground": A Summary Review
Dr. Amy Seidl is an ecologist by training, and the mother of a family trying to adapt to the "Age of Warming." It's a dual perspective that gives much insight on what our future may bring. Read about her realistic yet hopeful view here. - A Love Story And A Clearance Sale
Arctic sea ice is 'far away' for most of us--but will it become 'long ago', too? There's reason to fear just that--here's why the author cares, and why more practically-minded readers should, too. - Water Is A Dancer: Climate Science And The Element Of Change
The famous "blue marble" photo of the Earth shows a water planet. But water, "the element of change," is important to Earth in less obvious ways, too. Here's how it operates as a greenhouse gas. - Global Warming Science, Press, And Storms: Nils Ekholm
Scientists are expected to live and die on the quality and integrity of their data analysis—but usually that is a metaphor. Not for Nils Ekholm! Read the story of this remarkable scientist, self-made man and sometime Arctic explorer!